
Business Dashboards – How It Helps You Visualise Better
Apr 21, 2019
The world of business always had a healthy appreciation of true and timely information. Maps that charted trade routes containing valuable and sought-after information, and helped people visualise information long before GPS tools. Information about the goods someone would like to trade, and what they would want in return, was also paramount.
In the world before modern communication, information was scarce and valuable. Data points were few and far between. Insights were reduced to the most basic ones. And that kind of a world is completely foreign to us.
With every new day that passes, the world is richer for more than 2.5 quintillion of bytes of data. That’s 2.5 billion gigabytes, roughly, of fresh new data that’s created every day. Not all that data ends up in various funnels, metrics, or other types of business tools. In fact, fewer businesses are relying on data than you’d think, which is a problem tools like dashboards are built to solve.
Jim Bergeson
Data will talk to you if you’re willing to listen to it
Does Every Business Use Data?
Big data gets its name from the sheer volume of information that requires novel ways for computers to process it effectively. But the “big” in “big data” might as well come from the fact that big data is massively popular online. So not only does a Google search for “big data” yield close to seven billion results, but there’s also a staggering amount of content online that suggests its usefulness for businesses.
After reading a few of those articles, it would be hard not to imagine every business owner implementing data in every part of their business. But that’s not how things are, at all.
Data doesn’t reign supreme over the business world. A 2019 survey by NewVantage Partners found that 53% of the survey participants — Fortune 1000 companies — are failing to treat data as a business asset. 31% would say that their organisation is data-driven, and only 28% would say that they’ve created a data culture in the workplace.
The study also showed that nine out of ten businesses are investing more rapidly in big data, so we can expect to see the implementation rates increase. But the reasons behind the poor implementation are not technological in nature. The obstacles are in the people, the procedures, and the lack of organisational alignment.
Why Is Visualisation Important?
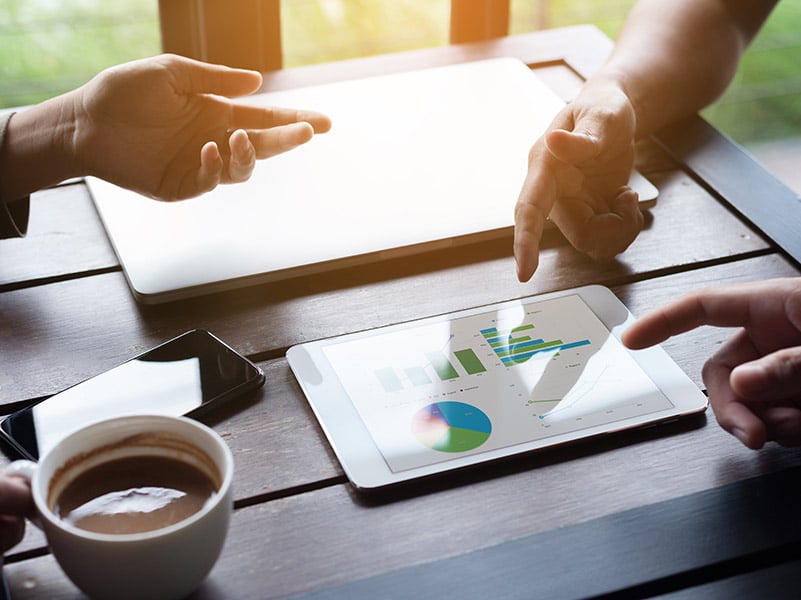
Dashboards are visualisation tools. It’s their job to take data from any sources you are using and present it in a way that’s easy to understand and, most importantly, easy to digest quickly. The improved visualisation can be of tremendous help when bringing data into the workplace culture and work procedures.
It’s important to know that, when using large sets of data, you will often have trouble presenting it. Reports are a common way to do it, and they serve that purpose adequately. Reports tend to be big and boring, so getting through them can be a time-wasting chore. They can provide a deeper level of insight, though.
The problem is that a deeper level of insight is not always called for. Sometimes, you’ll need to take in a large amount of data in seconds, and that’s not something you can do with a report. But it is something a dashboard is uniquely built to do.
We know, for example, that using visuals in learning can improve comprehension and that watching visual storytelling is a better learning method than reading an article. We also know that people are strongly drawn to visual content, with customer surveys showing that 91% prefer visual and interactive content. And while there are myths about how much faster the brain processes visuals than text, we know that it’s easier to follow a movie than a book, for example. It might be one of the reasons why Infographics are such a popular form of content.
A dashboard is like an Infographic — a visual representation of the crucial pieces of data. The one way a dashboard is better is because it’s not static and makes it more digestible. You can see real-time change on it. A dashboard is also highly customisable, which means that you get to see the information you need. And you can understand it better because it presents it with an easy-to-understand visual, be it an icon, a graph, or anything else.
Benefits of Using Business Dashboards

Business dashboards are a powerful tool for businesses because they allow them to track key metrics and identify trends.
There are many benefits to using business dashboards, including:
- Improved Decision Making
Business dashboards provide businesses with real-time data that can be used to make informed decisions. By tracking key metrics, businesses can quickly identify trends and make changes to their strategy as needed. For example, a marketing dashboard may show that a particular campaign is not performing as expected. This information can then be used to modify the campaign and improve its effectiveness. - Increased Efficiency
Business dashboards can help businesses to automate many of their reporting processes. This can save time and resources, allowing businesses to focus on other areas of their operations. For example, a finance dashboard may automatically update with the latest financial data, reducing the need for manual data entry. - Better Collaboration
Business dashboards can be used to facilitate collaboration between different departments within a business. By sharing data in a centralised location, everyone can stay on the same page and work together to achieve common goals. This can improve communication and lead to better outcomes.
Types of Business Dashboards
There are many different types of business dashboards that businesses can use. Some of the most common types as an example:
- Sales Dashboards
Sales dashboards are used to track sales performance. They may include information such as revenue, sales volume, and customer acquisition rates. Sales dashboards can be used to identify trends and opportunities for growth. - Marketing Dashboards
Marketing dashboards are used to track marketing performance. They may include information such as website traffic, social media engagement, and lead generation rates. Marketing dashboards can be used to identify which campaigns are performing well and which ones need to be modified. - Finance Dashboards
Finance dashboards are used to track financial performance. They may include information such as revenue, expenses, and cash flow. Finance dashboards can be used to identify areas where costs can be reduced, and revenue can be increased.
How to Implement a Dashboard and Use Visualisation to better understand your data
You already know that the dashboard is a visualisation tool, and that also means that it simplifies data representation for users. So instead of long rows of explanations and data points, you get a couple of charts with a few words. It’s built and customised to show a small part of all data you need therefore making you focus on the data that matters the most instead of getting lost in the sea of information.
Determining which sets of data matter the most and to whom will help integrate the use of data into processes. Department heads will have to produce a list of data points, among other requirements, they need from the dashboard. They will have to think about the important KPI’s they want to keep an eye on in real time.
That’s the perfect time to find a place in the process for the data the dashboard provides. Because the whole point of using a dashboard is to have quick access to essential data, using the dashboard doesn’t have to be time-consuming, so it’s easy to fit it in. Plus, it will look great, and people will like things that look great.
Choosing the Right Business Dashboard Tool
There are many different business dashboard tools available on the market. When choosing a tool, it is important to consider factors such as ease of use, customisation options, and integration capabilities. Some of the most popular business dashboard tools include Tableau, Power BI, and Domo.
Real-Life Examples of Successful Business Dashboards
There are many real-life examples of successful business dashboards. One example is the dashboard used by Heathrow to track airport passenger traffic in real time.
![]()
Another example is the dashboard used by Coca-Cola to track marketing performance across different regions and channels.
![]()
Conclusion
The key takeaway is that by the power of data visualisation, dashboards can solve businesses’ issues with big data implementation. It’s easier to see multiple data sources at a glance to help understand your data. There’s nothing better than having access to actionable data whenever you need to make a major decision. Well, nothing except seeing that same actionable data on a well-designed dashboard. Visualisation really is the best way to use data, and the dashboard is the best tool for that job.

